![](https://delcohomicides.swarthmore.edu/wp-content/uploads/2021/08/iconmonstr-mouse-7-240.png)
The Delaware County Homicide Database dashboard allows users to interact with the data across several variables.
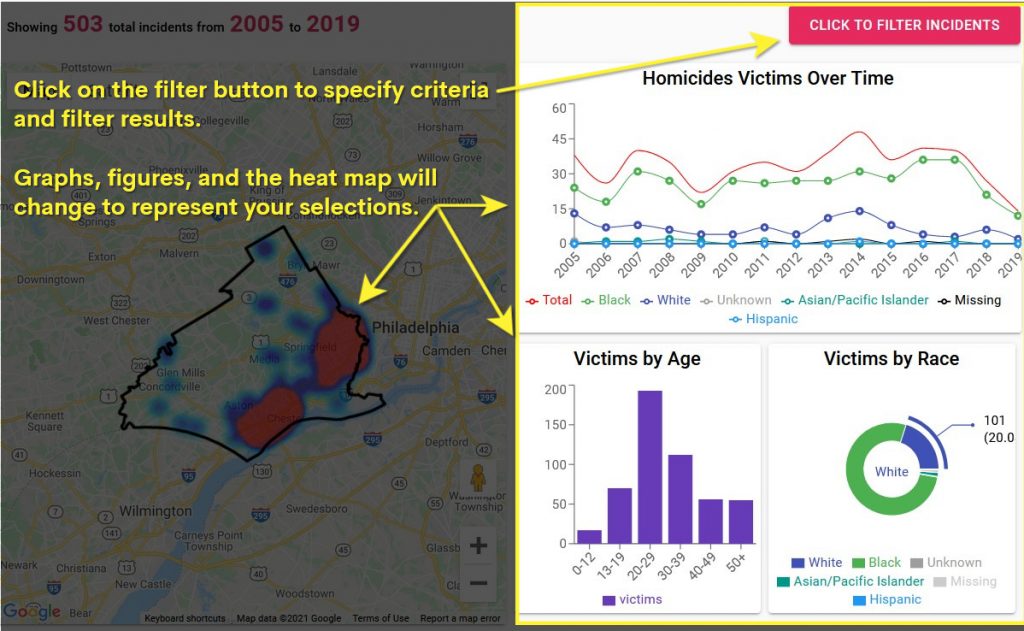
Step 1: Open the filter menu by clicking on the “filter incidents” button in the top right hand corner of the screen.
![](https://delcohomicides.swarthmore.edu/wp-content/uploads/2021/10/How-to-1-Screenshot-2021-10-26-annotate-1024x631.jpg)
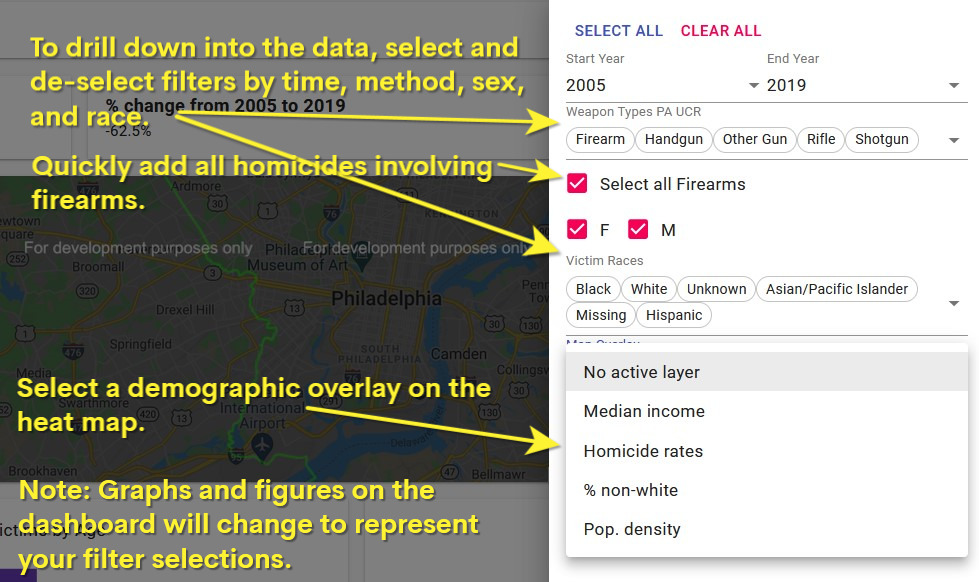
Step 2: Select and de-select filters according to your preferences.
![Annotated screenshot instructions: To drill down into the data, select and de-select filters by time, method, sex, and race. Quickly add all homicides involving firearms using the "Select all firearms" checkbox. Select a demographic overlay on the heat map. Note: Graphs and figures on the dashboard will change to represent your filter selections.](https://delcohomicides.swarthmore.edu/wp-content/uploads/2021/08/How-to-Screenshot-1-annotate2-yellow.jpg)
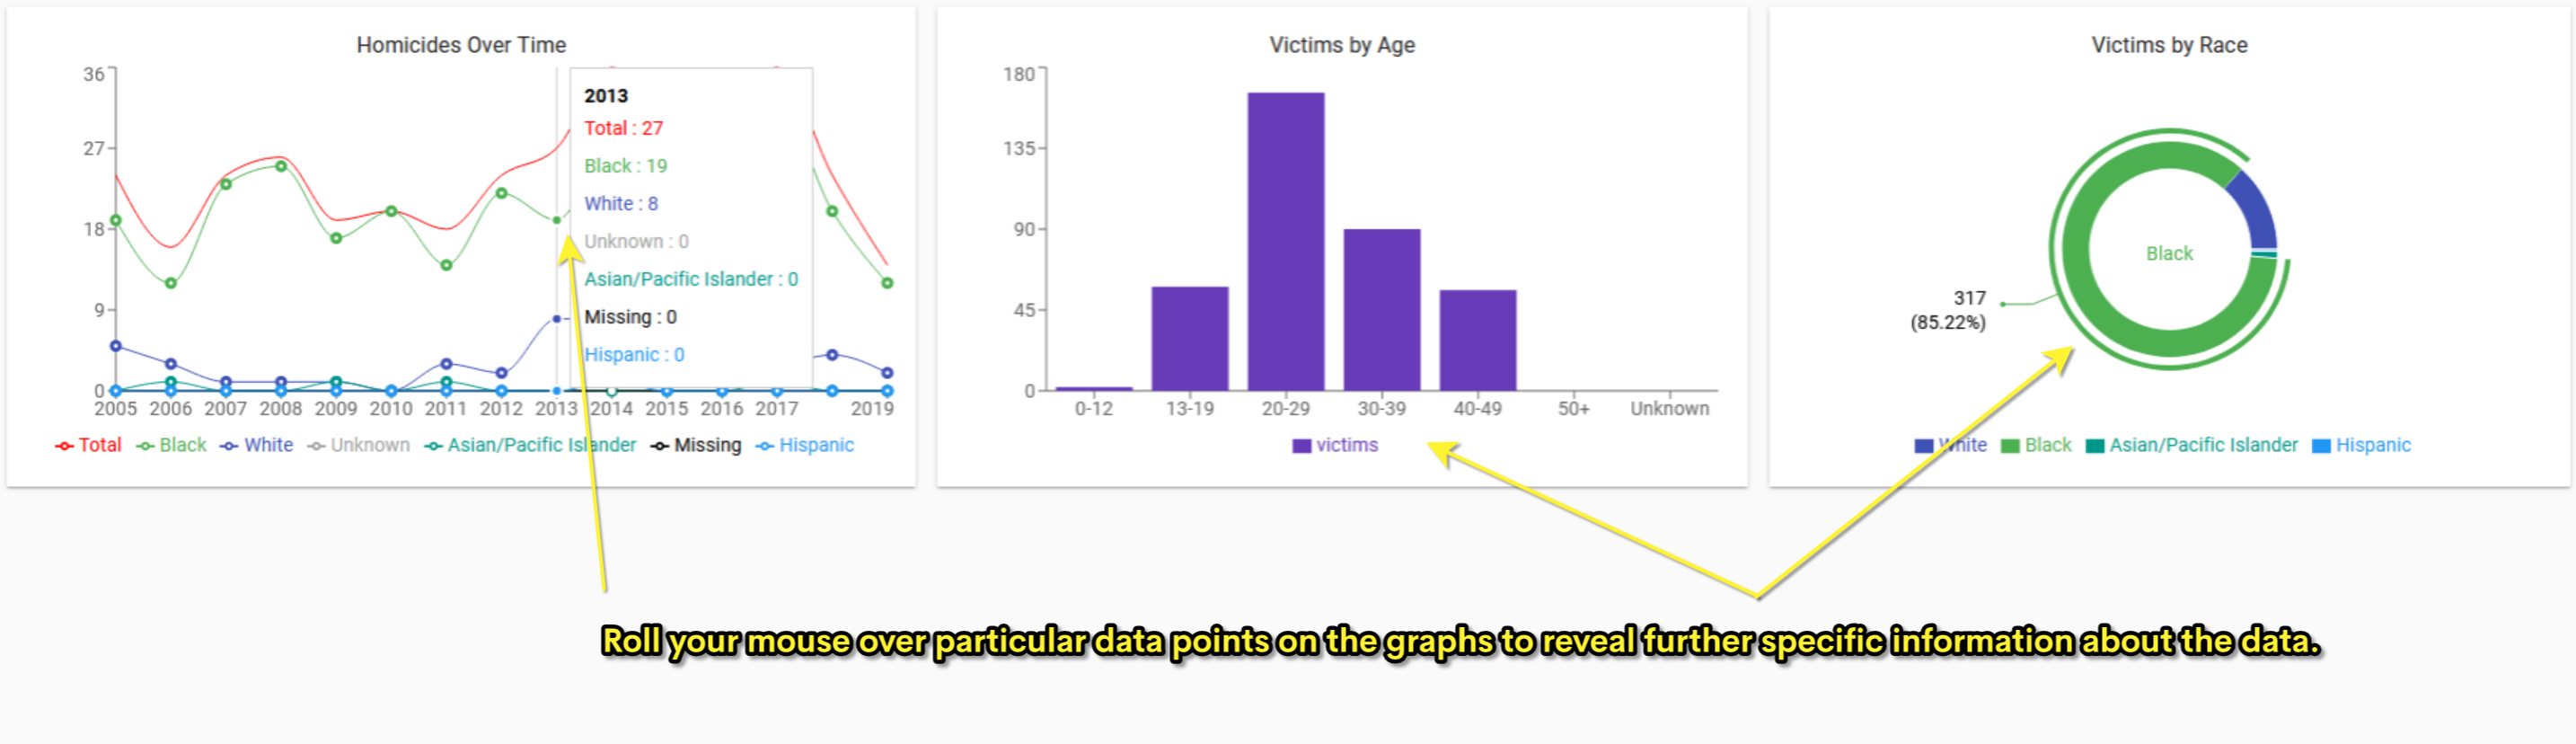
Step 3: Roll your mouse across data points in graphs to reveal more specific information.
![Annotated screenshot instructions: Roll your mouse over particular data points on the graphs to reveal further specific information about the data.](https://delcohomicides.swarthmore.edu/wp-content/uploads/2021/08/How-to-Screenshot-3-annotated.png)