N=437
Table of Contents
- Demographics
- Race
- Race + gender
- Gender
- Age
- Time Analysis of Homicide Data
- Days of week
- Hourly
- Per year
- Inside vs. Outside violence
- Location
- Location + gender
- Death Circumstances
- Percentage of Known Police-Involved Homicides
- Known vs. Unknown Death Circumstances
- “Justified” Police-Involved Killings vs. “Unjustified” Killings
- Automatic vs non-automatic
Introduction
The following analysis draws from the Delaware County Homicide database and is intended to support policy makers and community members in developing strategies for violence prevention. The majority of the analysis covers 437 cases of homicide in Delaware County from 2005-2016. However, some of the graphs represent fewer observations due to incomplete data. For those cases, the number of observations is displayed near the graph as “n=value.” We often compare our findings with data from other studies to ground this small dataset of Delaware County within the context of larger national trends.
Demographics
Introduction to Demographics: Homicide is not equally distributed in the United States. Instead, variables such as race, age, and sex plays significant roles in determining homicide rates.
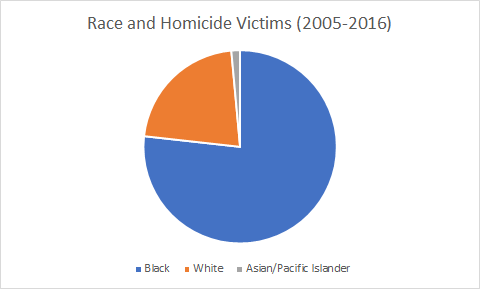
As seen above in the graph ‘Race and Homicide Victims’, it can be deduced that homicide affects the races unequally, with a majority of the victims being Black. (n=413)
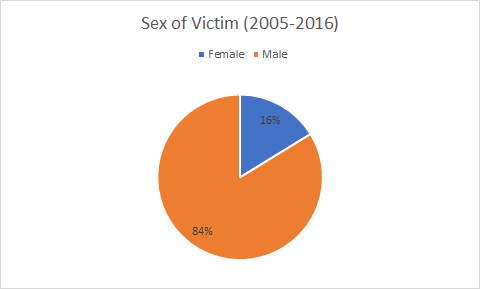
By the graph ‘Sex and Victim’ seen above, we can reason that homicide also affects the sexes unequally as men (84% of the homicide victims) are more likely to be killed than women (16% of the homicide victims) in Delaware County Pennsylvania. (n=431)
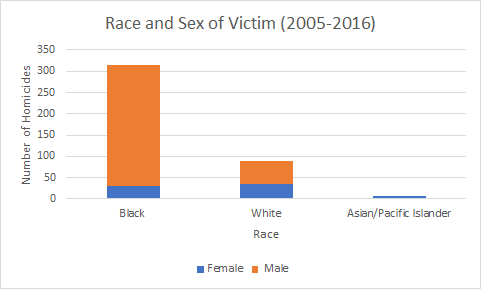
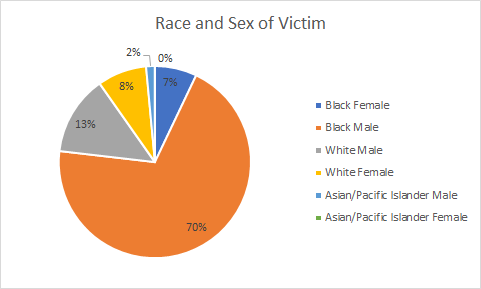
As seen by both graphs above titled ‘Race and Sex of Victim’, in Delaware County black men make up the largest percent of victims of homicide (70%) with white men following at (13%). The third and fourth highest percentage of victims are black and white women, both of which are statistically too close to be differentiated or have their statistics be analyzed against each other’s. (n=410)
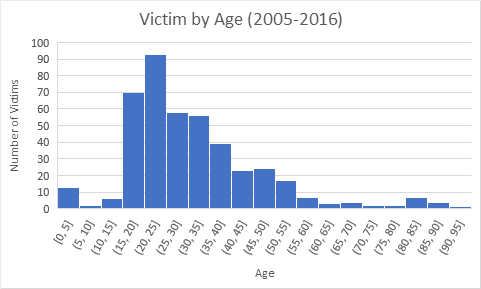
The graph titled “Victim by Age” details the number of people killed in Delaware County in 5 year intervals. (n=436)
Time Analysis of Homicide Data
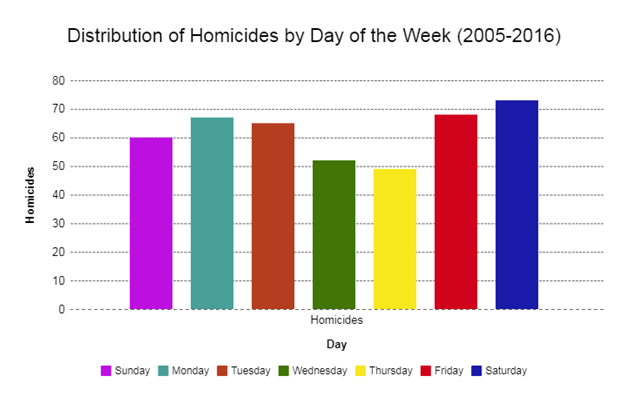
n=434
Organizing the data by day of the week illustrates that homicides occur on every day while it also reveals an interesting lull in violence mid week (on Wednesday and Thursday). Most homicides occur at the end of the week (Friday and Saturday). While the difference between homicides on Fridays (68) and Saturdays (73) could be due to chance, the difference between Wednesdays (52) and Thursdays (49) and the weekend days IS statistically significant. The interesting lull in violence mid week is a pattern that is not likely due to chance. This is especially true when considering that the sample was taken over an 11 year period.
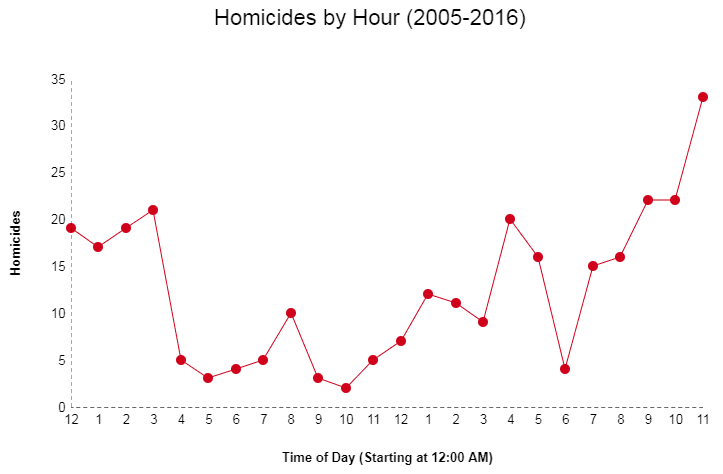
n=300
Aggregating the times when homicides have occurred from 2005-2016 reveals a u-shaped trend. the frequency of homicides rises during the night hours compared to daytime hours when the number of homicides remain relatively low. It appears that there is a spike at 4:00 PM which may be associated with the time when school lets out for the day. The most dangerous time period is from 11:00-11:59 PM which coincides with a total of 33 homicides.
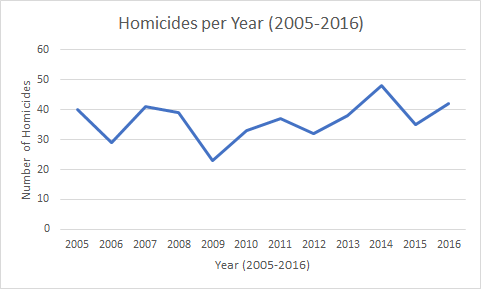
The number of homicides each year is a statistic that often gets a lot of attention. Police departments or politicians often tout percent decreases in homicides compared to the previous year. However, from an entirely statistical perspective, some random variation is expected and fluctuations in homicides from year to year are not always linked to policies and initiatives—they are instead random. So while the subtle rises and falls of this graph may not be linked to specific initiatives the average number of homicides in Delaware County can be seen (about 36 per year).
Inside vs. Outside Violence
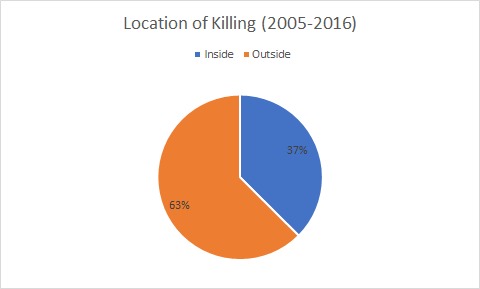
People killed in Delaware County between 2005-2016 were, on average, more likely to be killed outside (i.e. on the street/sidewalk) than they were inside (i.e. indoors). The impact of including the data category ‘victim sex’ is detailed in the analysis below. (n=321)
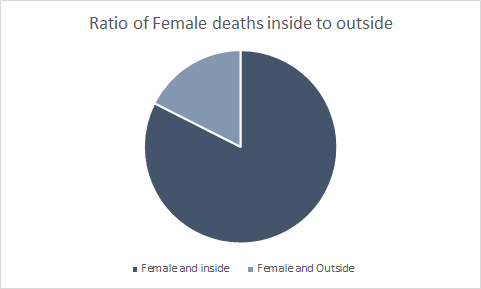
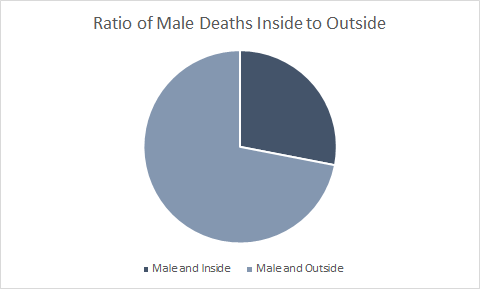
As seen above in Delaware County, men are more likely to be killed outside, while women are more likely to be killed inside. We might hypothesize that women in Delaware County are more likely than men to be killed as a result of domestic violence and may be more likely to be killed by a member of their own family or a close family friend.This is a similar conclusion reached by Hemenway in his book Private Guns Public Health, where he wrote about the lethality of domestic violence increasing in homes where a gun was present (Hemenway, p.123) (n=321)
Automatic versus Non-Automatic Weapons Usage
Introduction: An automatic weapon is a firearm that continuously fires rounds as the user holds the trigger.
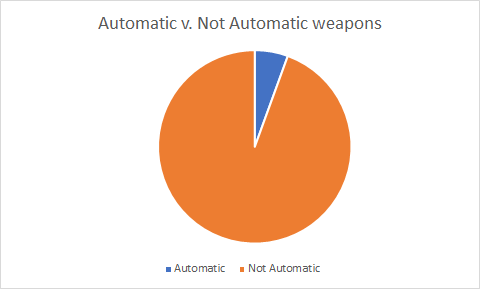
Though the number of automatic weapons is smaller than non-automatic weapons, the question of where these automatic weapons come from remains, especially as the sale of such weapons has been banned for approximately 30 years.
Death Circumstances and Police-Involved Homicides (2016)
Though police-involved shootings have been part of America’s history for decades, they have gained significant news coverage since Trayvon Martin’s death in 2012 (Lee, 2017). Numbers of police-involved killings have steadily increased, particularly between January 2013 and December 2016. Compared to 995 killings in 2015 and 963 in 2016, police have killed 1,079 U.S. residents in 2017 thus far (“Police Have Killed 1,079 People in the U.S. This Year.,” Mapping Police Violence, accessed December 2, 2017, https://mappingpoliceviolence.org). Across the United States, police brutality disproportionately affects young black men between the ages of sixteen and thirty-two: Black men are nearly three times as likely to be killed by police officers (Howard, 2016). Compared to their White and Hispanic peers, Black men are more likely to be victimized by officers, who are over twice as likely to use force when apprehending them, and over four times more likely to kill them when they are unarmed (Mapping Police Violence, 2015).
Due to the lack of FBI data on fatal police shootings, the Washington Post began to start tracking civilian deaths itself after Michael Brown was fatally shot by Officer Darren Wilson in Ferguson in August 2014. The post validates its data by monitoring reports in the media (BBC News, 2016). In line with the national trend, police-involved shootings have been increasing in the state of Pennsylvania. In 2015, 18 people were killed by police, and 22 killings were noted in 2016. The majority of the shootings target black men between the ages of 18 and 29 (“Police Shootings 2016 Database,” Washington Post, accessed December 2, 2017, https://www.washingtonpost.com/graphics/national/police-shootings-2016/). In attempts to identify information on police-involved shootings in Delaware County, this section compares the data on police-involved shootings to all known circumstances (or, conditions under which the killing occurred).
(n=49)
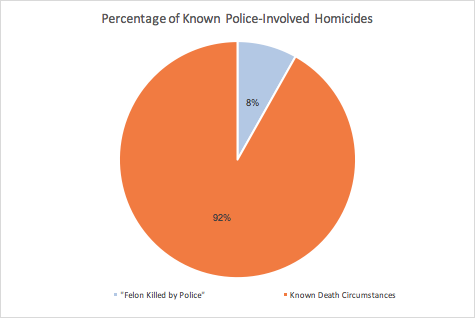
The Pennsylvania Uniform Crime Report for Delaware County identifies thirteen different types of known circumstances: conditions under which death occurred (e.g. “Lover’s triangle”, “Argument over money or property”). The majority of results for Death Circumstances are located within Unknown categories (n=370). Relying solely on known death circumstances (n=66), the chart above compares the circumstance “Felon Killed by Police” with the twelve other known circumstances listed in the Report. Between 2005 and 2016, “Felon Killed by Police” comprised 8% of known death circumstances, with the earliest police-involved killing occurring in 2006 and the most recent in 2016.
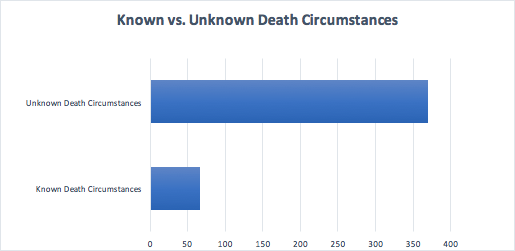
Number of Known vs. Unknown Death Circumstances in PA UCR dataset for Delaware County (2016)
(n=436)
Approximately 15-17% of death circumstances are listed as “known” within the PA Uniform Crime Report for Delaware County. A dearth of information makes analysis of the circumstances under which homicides occur difficult. Moreover, it is difficult to know whether the high number of unknown death circumstances is a result of faulty reporting or a lack of information at the time of reporting. PA UCR criteria for “known” homicides is described as follows: “For those killings that occur in conjunction with the commission of another felony, such as a robbery or a rape, the agency must identify the specific offense involved. In other criminal homicides, the agency must provide as much information as possible so that murders resulting from lovers’ quarrels, drunkenness, arguments over money, revenge, narcotics, gangland killings, etc., can be identified. Vague descriptions such as, altercation, fight, and quarrel, do not provide sufficient information for analysis and will not be accepted by the national UCR Program. Statements of circumstances must be based on information known to law enforcement following its investigation, not decisions of a grand jury, coroner’s inquest, or other agency outside law enforcement.” 1
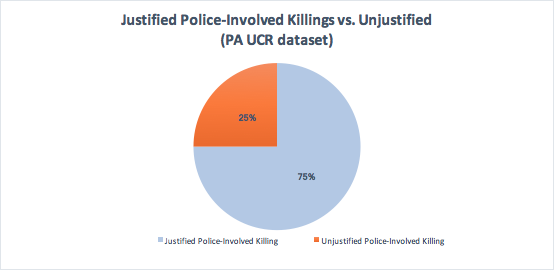
“Justified” vs. “Unjustified” Police-Involved Killings (2016)
(n=4)
Approximately 75% of police-involved killings were labeled as “justified” in the PA UCR dataset: no criminal charges were filed for any of these deaths. This finding is particularly critical, as “Only about a third of the cases for Chester’s 321 homicide victims since 2000 have been solved, a rate that is one of the lowest in the nation.” 2
References
Hemenway, D. (2017). Private guns, public health. Ann Arbor: University of Michigan Press.
- https://www2.fbi.gov/ucr/handbook/ucrhandbook04.pdf p.107.
- “Map: Unsolved Homicides in Chester.” Philly.com, August 17, 2016. http://www.philly.com/philly/infographics/390452541.html.